The Best AI Anime Infographic Maker
Turn world lore into infographics — survival guides, stat breakdowns, timelines.
Turn One Sentence Into Visual World Lore
Describe your infographic idea and Neta Studio generates anime-styled stat sheets, timelines, survival guides, and classified documents that make complex worldbuilding instantly readable.
What You Can Create
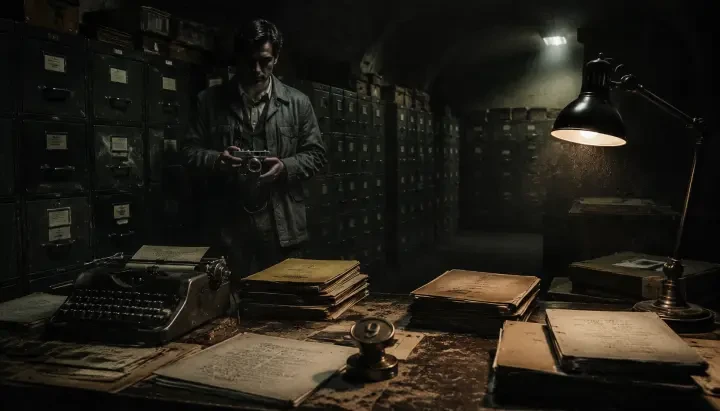
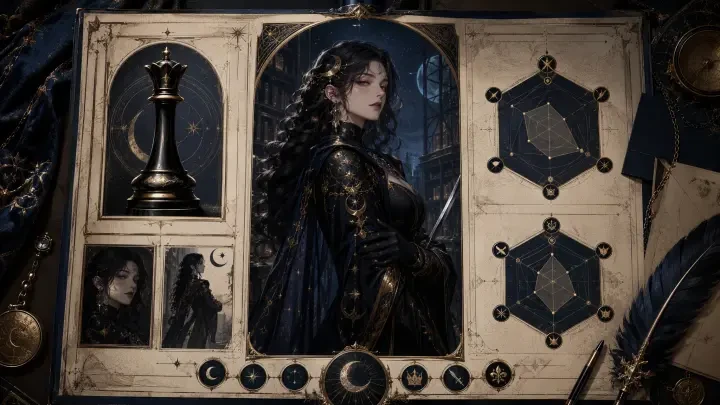
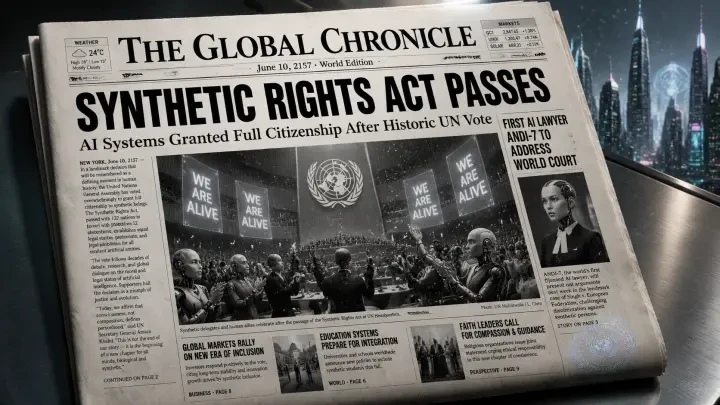
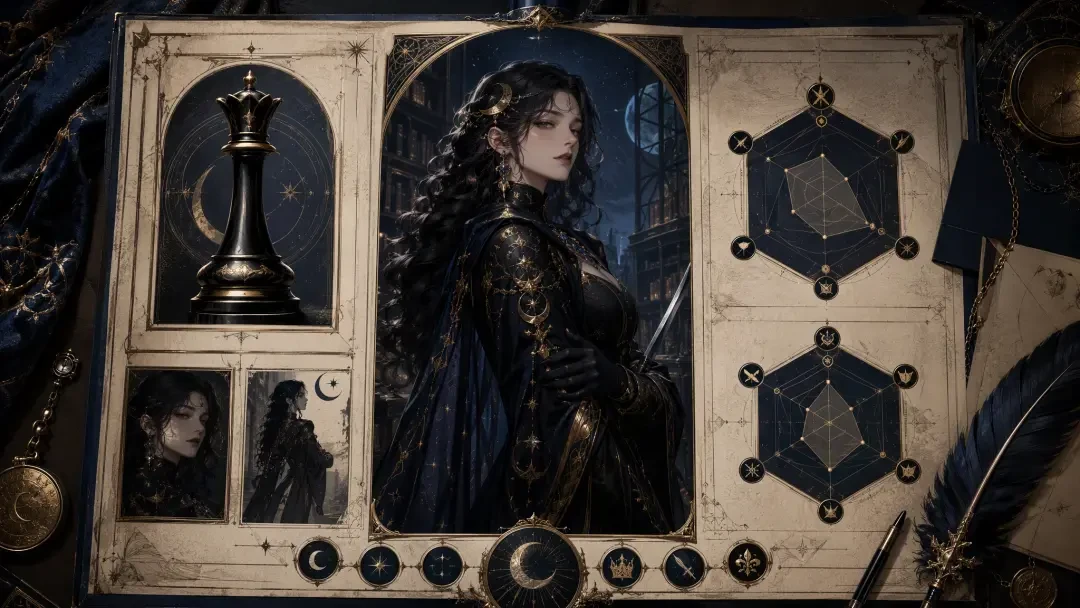
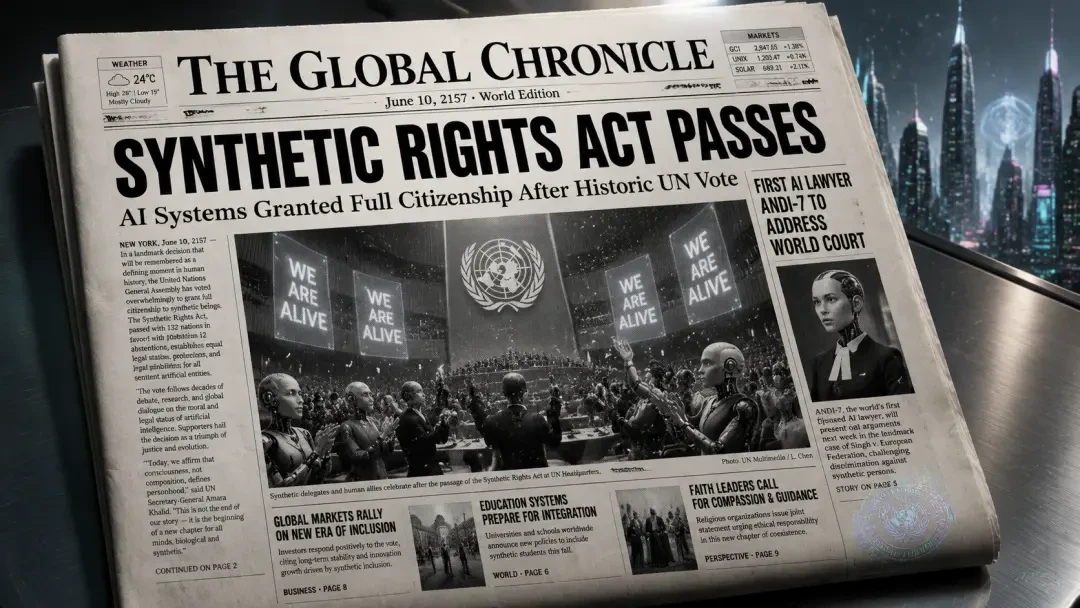
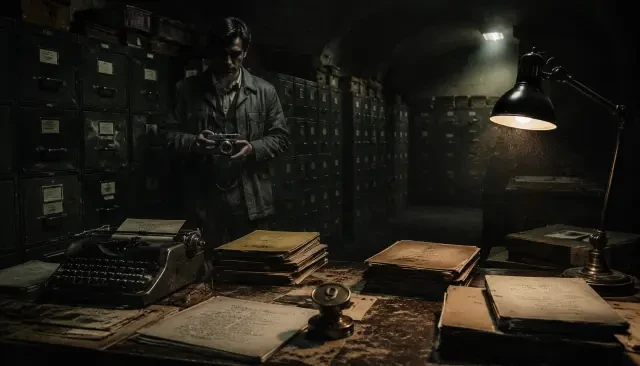
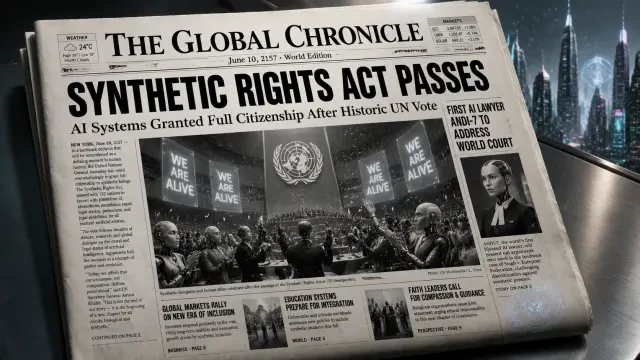
Neta Studio transforms world lore into shareable infographics that communicate complex systems at a glance. Generate character profile cards like "Character Profile Card — Evelyn Nocturne, the Lunar Archivist" with stats, skills, and backstory. Build historical documents like "Historical Newspaper: Robot Awakening Declaration" that anchor pivotal moments in your timeline. Design classified archives like "Bureau Nine Classified Intranet — Anomalous Affairs Archive Web App | Play Online" that organize conspiracy theories, case files, and investigation boards. Every infographic maintains anime aesthetics while delivering information clearly.
- Character stat sheets — combat abilities, personality traits, relationship webs, equipment loadouts.
- Survival guides — threat assessments, safe zones, creature behavior patterns, resource maps.
- Timeline infographics — historical events, war progressions, dynasty rises and falls, apocalypse countdowns.
- System breakdowns — magic hierarchies, tech tree diagrams, faction power structures, economic flows.
- Classified documents — investigation boards, case files, anomaly reports, conspiracy maps.
Why Neta Studio Beats Generic Infographic Tools
Generic tools force you to drag boxes and pick fonts for hours. Neta Studio understands anime worldbuilding context — describe your infographic in one sentence and the AI composes layout, illustration, typography, and data visualization together. Fork "Historical Newspaper: Robot Awakening Declaration" to spin off your own alternate history. Remix "Character Profile Card — Evelyn Nocturne, the Lunar Archivist" to match your power system. Every element is editable through natural language iteration, not fiddly alignment grids.
| Generic Tools | Neta Studio |
|---|---|
| Drag-drop templates | One-sentence generation |
| Stock icon libraries | Custom anime illustrations |
| Manual data entry | AI-structured content |
| Static PNG export | Interactive, forkable works |
| Generic aesthetics | Anime-native design language |
How It Works: Brief to Infographic in Minutes
Write your one-sentence brief
Describe the infographic type, content, and aesthetic. "A faction relationship chart for five warring guilds in dark fantasy anime style" or "Survival guide for the Abyssal Rift showing danger zones and escape routes."
AI builds your world board
Neta Studio structures the information hierarchy, assigns visual hierarchy, and generates illustration components that match anime aesthetics — character portraits, icons, diagrams, decorative elements.
Generate your infographic
The AI composes layout, typography, color palette, and data visualization into a cohesive infographic. All elements work together to communicate your lore clearly while maintaining visual appeal.
Iterate with natural language
Refine details by describing changes: "make the threat levels more dramatic," "add a legend explaining the symbols," "shift the color scheme to cyberpunk neon." No drag-and-drop required.
Publish, share, or fork
Export high-res images for social media, embed interactive versions in your world wiki, or let others fork your infographic as a template for their own lore. Start from works like "Bureau Nine Classified Intranet — Anomalous Affairs Archive Web App | Play Online" to build on proven structures.
Example: Character Stat Sheets and Profile Cards
Character infographics condense backstory, abilities, and relationships into scannable visuals. Fork "Character Profile Card — Evelyn Nocturne, the Lunar Archivist" and describe your protagonist: stats bars for combat/magic/social skills, trait tags, faction affiliations, key relationships, signature equipment. The AI generates anime portraits integrated with data visualization — stat bars that feel like UI overlays, trait badges that match your world's aesthetic, timeline snippets that hint at character arc. Perfect for character rosters, social media reveals, or interactive character selectors in visual novels.
"Create a character profile card for Kaito Shimura, a rogue AI researcher: high intelligence and hacking, low combat, neutral morality. Show his faction as ex-MegaCorp, relationships with three allies and one enemy, and signature gear including neural implant and data knife. Cyberpunk anime aesthetic with neon blue accents."
This brief generates a full character infographic with organized stat sections, illustrated portrait, and visual hierarchy that guides the eye from portrait to stats to lore callouts.
Example: Timelines and Historical Documents
Historical infographics anchor your world's past and make alternate histories tangible. Start from "Historical Newspaper: Robot Awakening Declaration" to create front pages, propaganda posters, or timeline spreads. Describe key events: "A timeline infographic of the Vampire Court succession from 1200-1800, showing five dynasties with portraits, key policy shifts, and bloody transitions in gothic anime style." The AI generates period-appropriate typography, illustrated historical figures, annotated event markers, and visual motifs that reinforce the era's mood. Use them as chapter dividers, loading screens, or shareable lore drops.
Example: World System and Investigation Boards
System infographics explain how your world works — magic hierarchies, political power structures, conspiracy webs. Fork "Bureau Nine Classified Intranet — Anomalous Affairs Archive Web App | Play Online" to build investigation boards, case file layouts, or anomaly classification charts. Describe the system: "A conspiracy board connecting seven secret organizations through shared members, funding trails, and covert operations, with red string visuals and classified document aesthetic." The AI organizes complex relationships into readable node-and-edge diagrams, annotates connections with evidence snippets, and applies thematic styling that matches spy-thriller or occult detective genres.
- Magic system diagrams — elemental wheels, spell tier hierarchies, mana flow charts with anime-style runic icons.
- Tech trees — mech upgrade paths, cybernetic augmentation progressions, weapon modification branches.
- Faction power maps — territory control, influence spheres, alliance webs with illustrated faction emblems.
- Threat assessment guides — monster danger ratings, boss mechanics breakdowns, dungeon hazard catalogs.
- Economic infographics — trade route maps, resource distribution, black market flow charts with stylized currency and goods icons.
Who Uses Anime Infographic Makers
Visual novel creators use stat sheets for character selection screens and relationship trackers. Worldbuilders generate timelines and system diagrams to organize complex lore before writing. Content creators make shareable infographics that tease upcoming story arcs or explain world mechanics to followers. Game designers prototype UI layouts and player-facing reference guides. Dungeon masters create handouts that explain homebrew rules, faction standings, or quest objectives. Anyone building fictional worlds benefits from infographics that communicate structure clearly while maintaining immersive aesthetics.
Infographic Styles and Aesthetic Control
From Infographic to Interactive Experience
Iterating and Refining Your Infographic
Example Prompts That Work
- "Survival guide for a cursed forest — equipment tier list, danger zones map, escape route flowchart" — generates layered infographic with icons and gradient risk zones.
- "Character stat sheet, JRPG style — STR/DEX/INT bars, element affinities, skill tree preview" — outputs classic RPG profile card with pixel-art aesthetic toggles.
- "Timeline: mecha war from first prototype to final ceasefire, key battles and treaties" — produces horizontal or vertical timeline with date nodes and milestone illustrations.
- "Faction comparison table — three rival guilds, their specialties, resources, and alliances" — builds side-by-side comparison chart with color-coded rows.
- "Investigation board: suspect photos, evidence tags, red-string connections" — mirror the layout of "Bureau Nine Classified Intranet — Anomalous Affairs Archive Web App | Play Online" with dynamic link overlays.
Publishing, Sharing, and Forking
Export Options and Formats
Collaboration and Team Workflows
Comparing Traditional vs AI Infographic Tools
| Feature | Generic Tools | Neta Studio |
|---|---|---|
| Anime style accuracy | Generic templates | Manga/anime aesthetic baked in |
| Worldbuilding integration | None — standalone graphics | World board syncs all infographics |
| Iteration speed | Manual layout for each version | One-click regenerate with edits |
| Interactive export | Static images only | Hover, click, animate — full web components |
| Collaboration | File handoff, version chaos | Real-time team board, version history |
| Forking & remixing | Not supported | Every work is forkable by design |
Real Creator Experience
I used to spend hours in Illustrator wrestling with stat bar alignment and icon placement. Now I brief Neta Studio with 'cyberpunk hacker profile — skill tree, rep bars, cyberdeck loadout' and iterate from there. My worldbuilding Notion doc links directly to live infographics, so when I update a faction's territory, the map infographic reflects it. Forking 'Character Profile Card — Evelyn Nocturne, the Lunar Archivist' gave me the perfect template for my entire cast.
This workflow — brief, generate, refine, fork — has become standard for indie game devs, webcomic creators, and TTRPG designers who need consistent, high-quality infographics without the design bottleneck.
Tips for Better Infographic Prompts
Common Questions About AI Anime Infographics
Can I use these infographics commercially? +
Yes. All generated assets are yours to use in commercial projects — indie games, published novels, print-on-demand merch, Patreon-exclusive content. Check Neta Studio's terms for specifics, but standard use grants full commercial rights to your outputs.
Do I need design skills to make good infographics? +
No. Neta Studio handles layout, typography, color harmony, and icon selection. You focus on the content — what stats matter, which events go on the timeline, how factions compare. The AI ensures visual consistency and anime-appropriate styling, so even first-time creators produce portfolio-ready work.
Can I make interactive infographics, not just static images? +
Absolutely. Export as web components for hover tooltips, clickable legend keys, animated stat reveals, and linked navigation. "Bureau Nine Classified Intranet — Anomalous Affairs Archive Web App | Play Online" demonstrates full interactivity — case files expand, evidence tags highlight, red-string connections animate on hover.
What if I want to change the style after generating? +
Iterate freely. Swap color palettes, toggle between manga/anime/pixel-art modes, adjust font weights, or regenerate specific sections while keeping the rest intact. The world board preserves your data, so style changes never require rewriting content from scratch.
How do I keep infographics consistent across a series? +
Your world board is the single source of truth. Define your faction colors, character stats, and timeline dates once, then generate as many infographics as you need. Updates propagate automatically, so if you buff a character's power level, every stat sheet and comparison table reflects the new value. Fork a template like "Character Profile Card — Evelyn Nocturne, the Lunar Archivist" to ensure uniform layout across your cast.
From Draft to Published Portfolio Piece
Start Building Your Anime Infographics Today
Start Creating
Turn world lore into stunning anime infographics — no design degree required.